Methodology
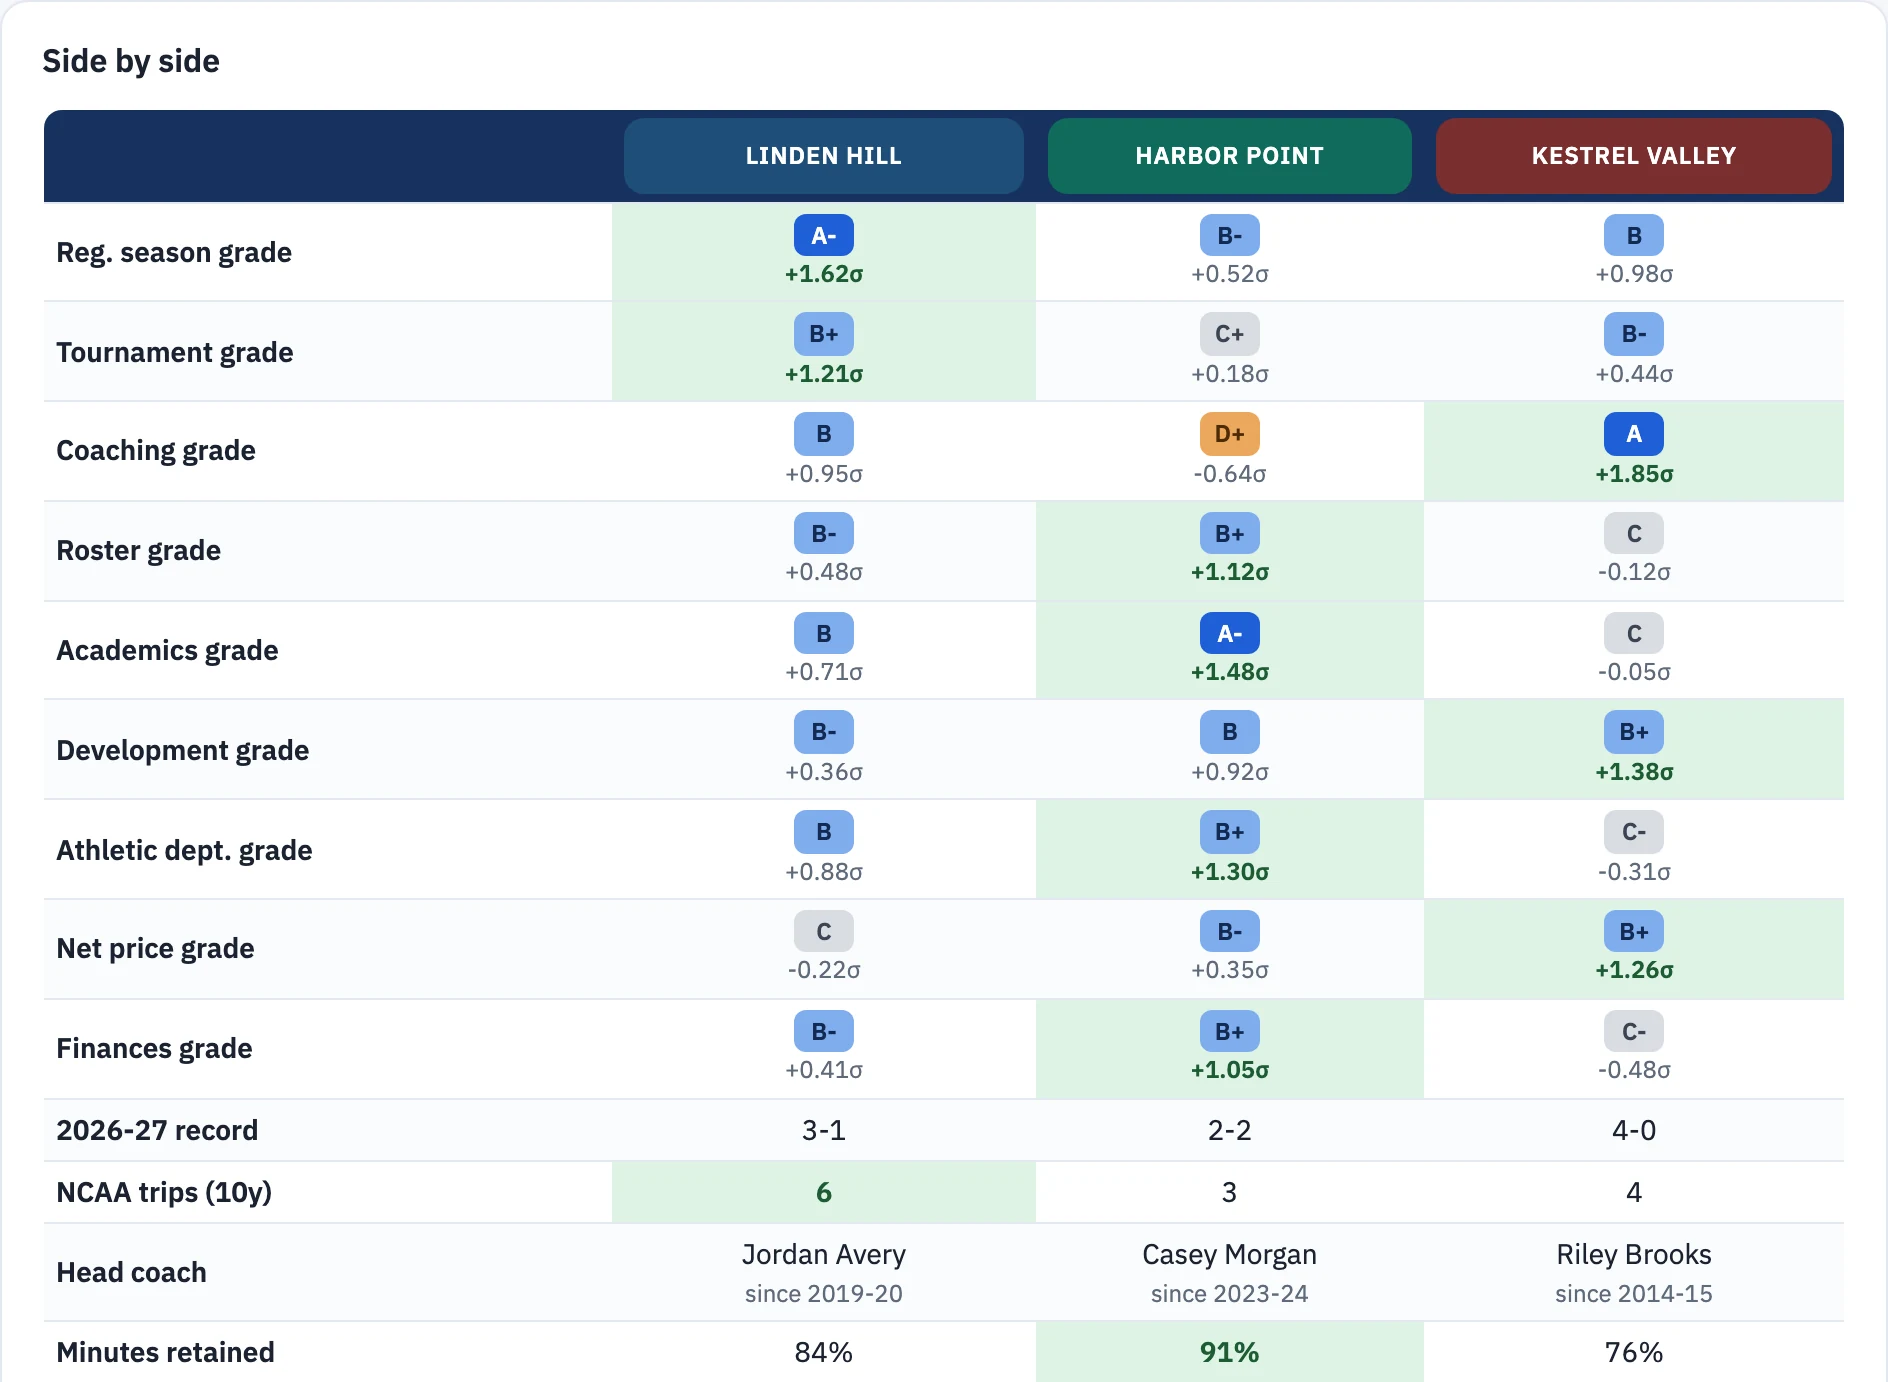
Grades measure distance from the D3 average in standard deviations (σ).
A+ starts at +2.25σ. C covers the average.
Grades cover the last 10 seasons. Newer seasons count more. The 2026-27 season counts in full, 2025-26 counts 78%, 2024-25 counts 61%, and 2023-24 counts 47%. The weight keeps falling each season, to 11% for 2017-18.
Each letter covers a fixed σ range, so the number of schools at each letter changes from
grade to grade. A historic outlier grades far above a strong program, and programs with similar
resumes grade alike. Hover any grade for its exact σ and percentile.
Reg. season: win percentage plus a bonus for making the NCAA field.
Tournament: NCAA wins and how deep each run went.
Coaching stability: current coach tenure minus a penalty per head-coaching
change in the last decade.
Coaching grade scope: the grade measures the stability of the head-coaching
position over the last 10 years. Stability usually signals overall program health. A coach's effect on the
program shows more in the Reg. season, Tournament, Roster, and Development grades. No grade here
covers personality or coaching style.
Roster stability: minutes-weighted retention (two thirds) and freshman
share of minutes (one third). Retention is the share of non-senior minutes that came back the
next season, found by comparing each team's consecutive roster pages. Seniors and graduate
students who leave do not count against a program. Freshman share of minutes pools the minutes
of the last three rosters.
Roster grade caveat, class years: the class year for each player comes
from the team's own roster page. We do not know whether a team lists academic class or athletic
eligibility, and teams may differ.
Some players graduate with eligibility left and skip a final season. If the roster lists such
a player as a junior, she looks like an underclassman who left, and her departure lowers the
program's retention. The same happens when a player stops playing to focus on academics.
We cannot separate those cases from a player who left the team for other reasons. Every
non-senior who does not return counts the same. Treat the Roster grade and the "Left early"
lists as an estimate built on that assumption.
Academics: graduation rate and selectivity (from the acceptance rate), both
from the Integrated Postsecondary Education Data System (IPEDS), a U.S. Department of Education
survey.
Player development: returning players' year-over-year growth in production
rate (pts+reb+ast per 30 min) and role (minutes). Each is measured against the typical D3
progression for a player at the same starting level and class, which removes regression to
the mean.
Holding an elite rate counts as development. A routine bounce from a low base earns no
credit. The grade weights players by minutes, across every offseason from 2023-24 to 2025-26. A season counts once it is
finished.
Athletic dept.: average Learfield Directors' Cup points per season across
10 seasons, 2014-15 to 2025-26. The National Association of Collegiate Directors of Athletics
(NACDA) publishes the standings and published none for 2019-20 or 2020-21. The Cup scores a
school's finishes in NCAA championships across all sports, men's and women's, up to 18 sports a
year.
A season with no points counts as zero, including seasons before a school joined Division
III. The grade says nothing about the basketball program itself.
Net price: the average net price for full-time first-year students who got
grant aid. Lower prices grade higher. The grade uses the price for all families, even when you
pick a family income. A school with no reported price grades at the D3 average.
School finances: the change in undergraduate enrollment from fall 2013 to
fall 2023. The second measure is the endowment per full-time-equivalent student at the end of
fiscal year 2023. Both come from IPEDS. Each is measured on a log scale, so a school that doubled and a school
that halved sit the same distance from no change. The two count equally.
Some campuses merged and now report as one school, such as the three Vermont State
campuses. Their 2013 count covers one campus and their 2023 count covers the merged school, so
we leave their enrollment change blank. Some campuses report their endowment through a parent
university and show none.
Federal oversight: the profile also shows two Department of Education
measures that the grade does not use. The financial responsibility composite score runs from
-1.0 to 3.0. A score of 1.5 or higher passes, 1.0 to 1.4 passes with extra oversight, and below
1.0 fails. Only private schools get one, so it would grade only part of the field.
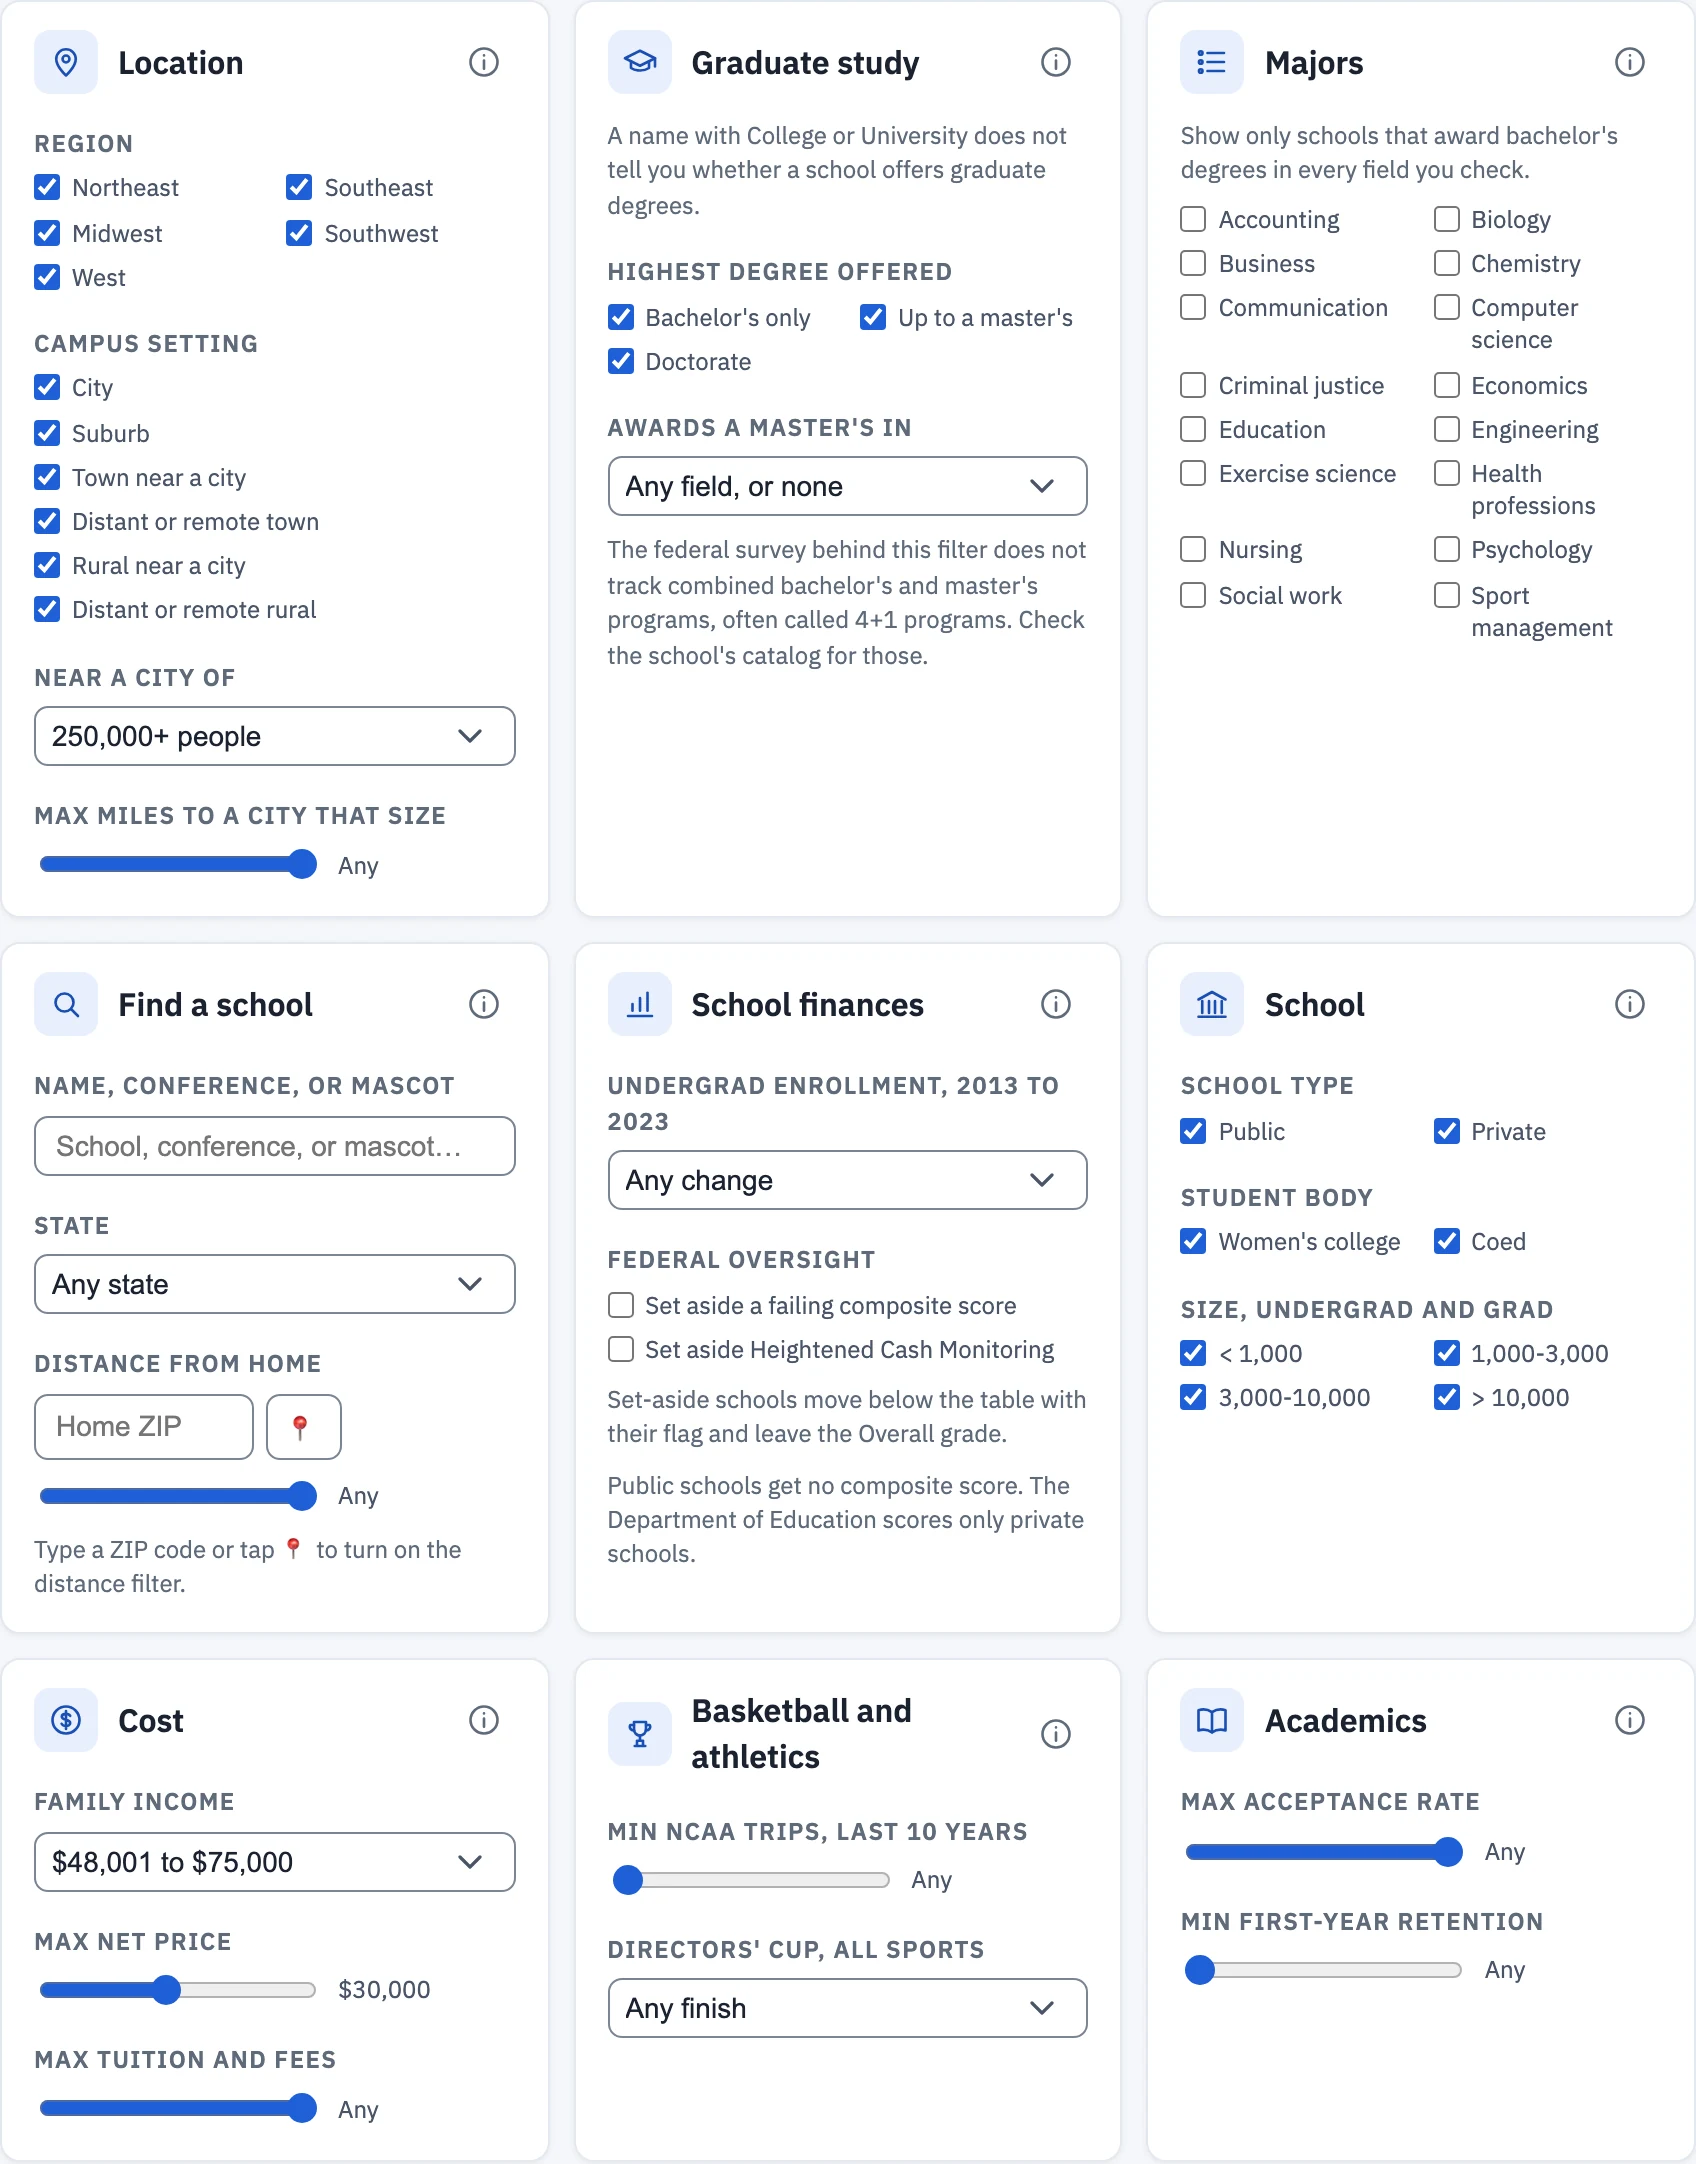
Every school with a failing score or a cash-monitoring listing shows a label beside its name.
The Federal oversight checkboxes move those schools below the table instead of hiding them, and
set-aside schools leave the Overall grade.
Heightened
Cash Monitoring is a list of schools under extra federal oversight of their student aid money,
with the reason for each.
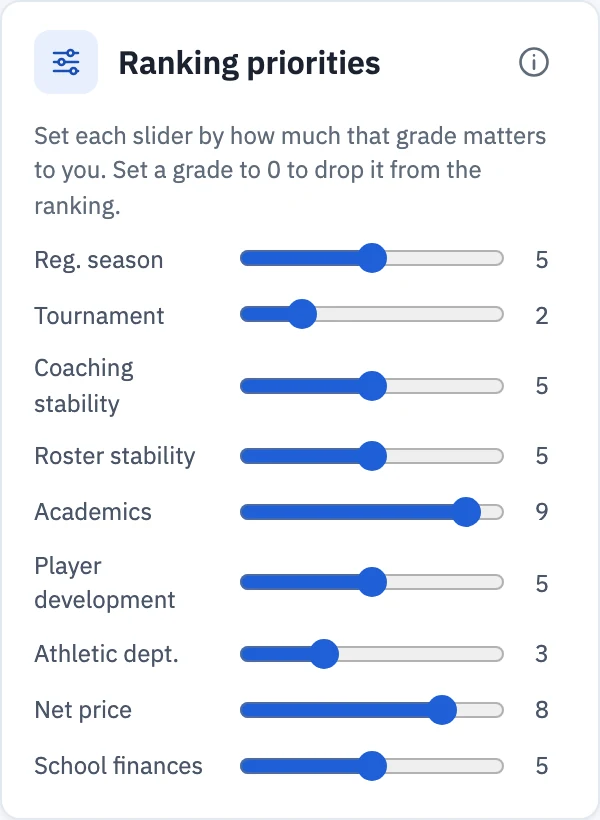
The Overall grade re-ranks the schools that match your filters using your
priority weights over the component σ-scores, then re-grades within that filtered set. Set a
priority to 0 to drop that grade from the ranking.
Campus setting and nearest city: the setting is the locale code from the
National Center for Education Statistics (NCES). It measures distance from the campus to an
urban area. Nearest-city distances are straight-line miles to the closest U.S. city of each
size, so they ignore cities in Canada.
Graduate study: the highest degree offered comes from the
IPEDS directory. A school awards a master's in a field when it awarded at least one master's degree
in it in July 2022 to June 2024. IPEDS has no field for combined bachelor's and master's (4+1)
programs, so check the school's catalog for those.
Women's colleges: the label follows the Women's College
Coalition member list, with two exceptions. William Smith counts as a women's college: it is the
women's college paired with Hobart, with one shared campus and one federal record. Mississippi
University for Women (MUW) is a member but counts as coed. It began admitting men in 1982.
Distance from home: straight-line miles from your ZIP code or
your location to each campus. A ZIP code maps to the average location of the IPEDS campuses with
the same first three digits. A distance can be off by several miles.
Majors: a school offers a field when it awarded at least one bachelor's
degree in it in either of the last two years in IPEDS. A school that reports degrees only as
liberal arts or interdisciplinary studies shows no fields. Check the school's catalog before
you rule it out.